
Enhancing Diagnosis of Mild Cognitive Impairment through Brain–Heart–Gut Metabolic Networks in Whole-body PET Imaging
Cell Reports Medicine 2026
Fan Li1,2,3*, Shuwei Bai2,4*, Yuxiao Liu2, Ziyi Chen2, Shilun Zhao2, Zhongxiang Ding5, Fang Xie6, Yin Xu1, Ling Yue7, Han Zhang2,4, Ya Zhang3,8†, Kaicong Sun2†, Dinggang Shen2,4,9 †
1 Cooperative Medianet Innovation Center, Shanghai Jiao Tong University, Shanghai 200240, China
2School of Biomedical Engineering & State Key Laboratory of Advanced Medical Materials and Devices, ShanghaiTech University, Shanghai 201210, China
3Shanghai Artificial Intelligence Laboratory, Shanghai 200232, China
4Shanghai Clinical Research and Trial Center, Shanghai 201210, China
5Department of Radiology, Affiliated Hangzhou First People’s Hospital, Xihu University School of Medicine, Hangzhou 310030, China
6Department of Nuclear Medicine & PET Center, Huashan Hospital, Fudan University, Shanghai 200040, China
7Department of Geriatric Psychiatry, Shanghai Mental Health Center, Shanghai Jiao Tong University School of Medicine, Shanghai 200030, China
8School of Artificial Intelligence, Shanghai Jiao Tong University, Shanghai 200240, China
9Shanghai United Imaging Intelligence Co., Ltd., Shanghai 200230, China
*Equal contribution †Corresponding author
Abstract
Mild cognitive impairment (MCI) is the prodromal stage of dementia involving complex interactions between the brain and peripheral organs. Emerging evidence indicates that heart dysfunction and gut microbiota dysbiosis contribute to MCI pathogenesis. Here, we present a framework integrating brain-heart-gut interactions using whole-body positron emission tomography (PET) to enhance brain-only diagnostic performance. Our brain-only model achieves diagnostic performance comparable to that of whole-body PET and shows promising generalizability across four datasets comprising 1,543 whole-body PET and 1,721 brain PET images. We identify key brain regions involving the limbic, parietal, frontal, and temporal cortices that engage the default mode, central autonomic, and sensorimotor networks. These regions, along with specific myocardium and distal colon, constitute an integrated brain-heart-gut metabolic network, underscoring multi-organ crosstalk mediated by neural, biochemical, and mechanical pathways. Overall, our generalizable framework not only shows great potential for clinical translation in MCI diagnosis but also provides broad applicability to other systemic diseases beyond MCI.
Methodology
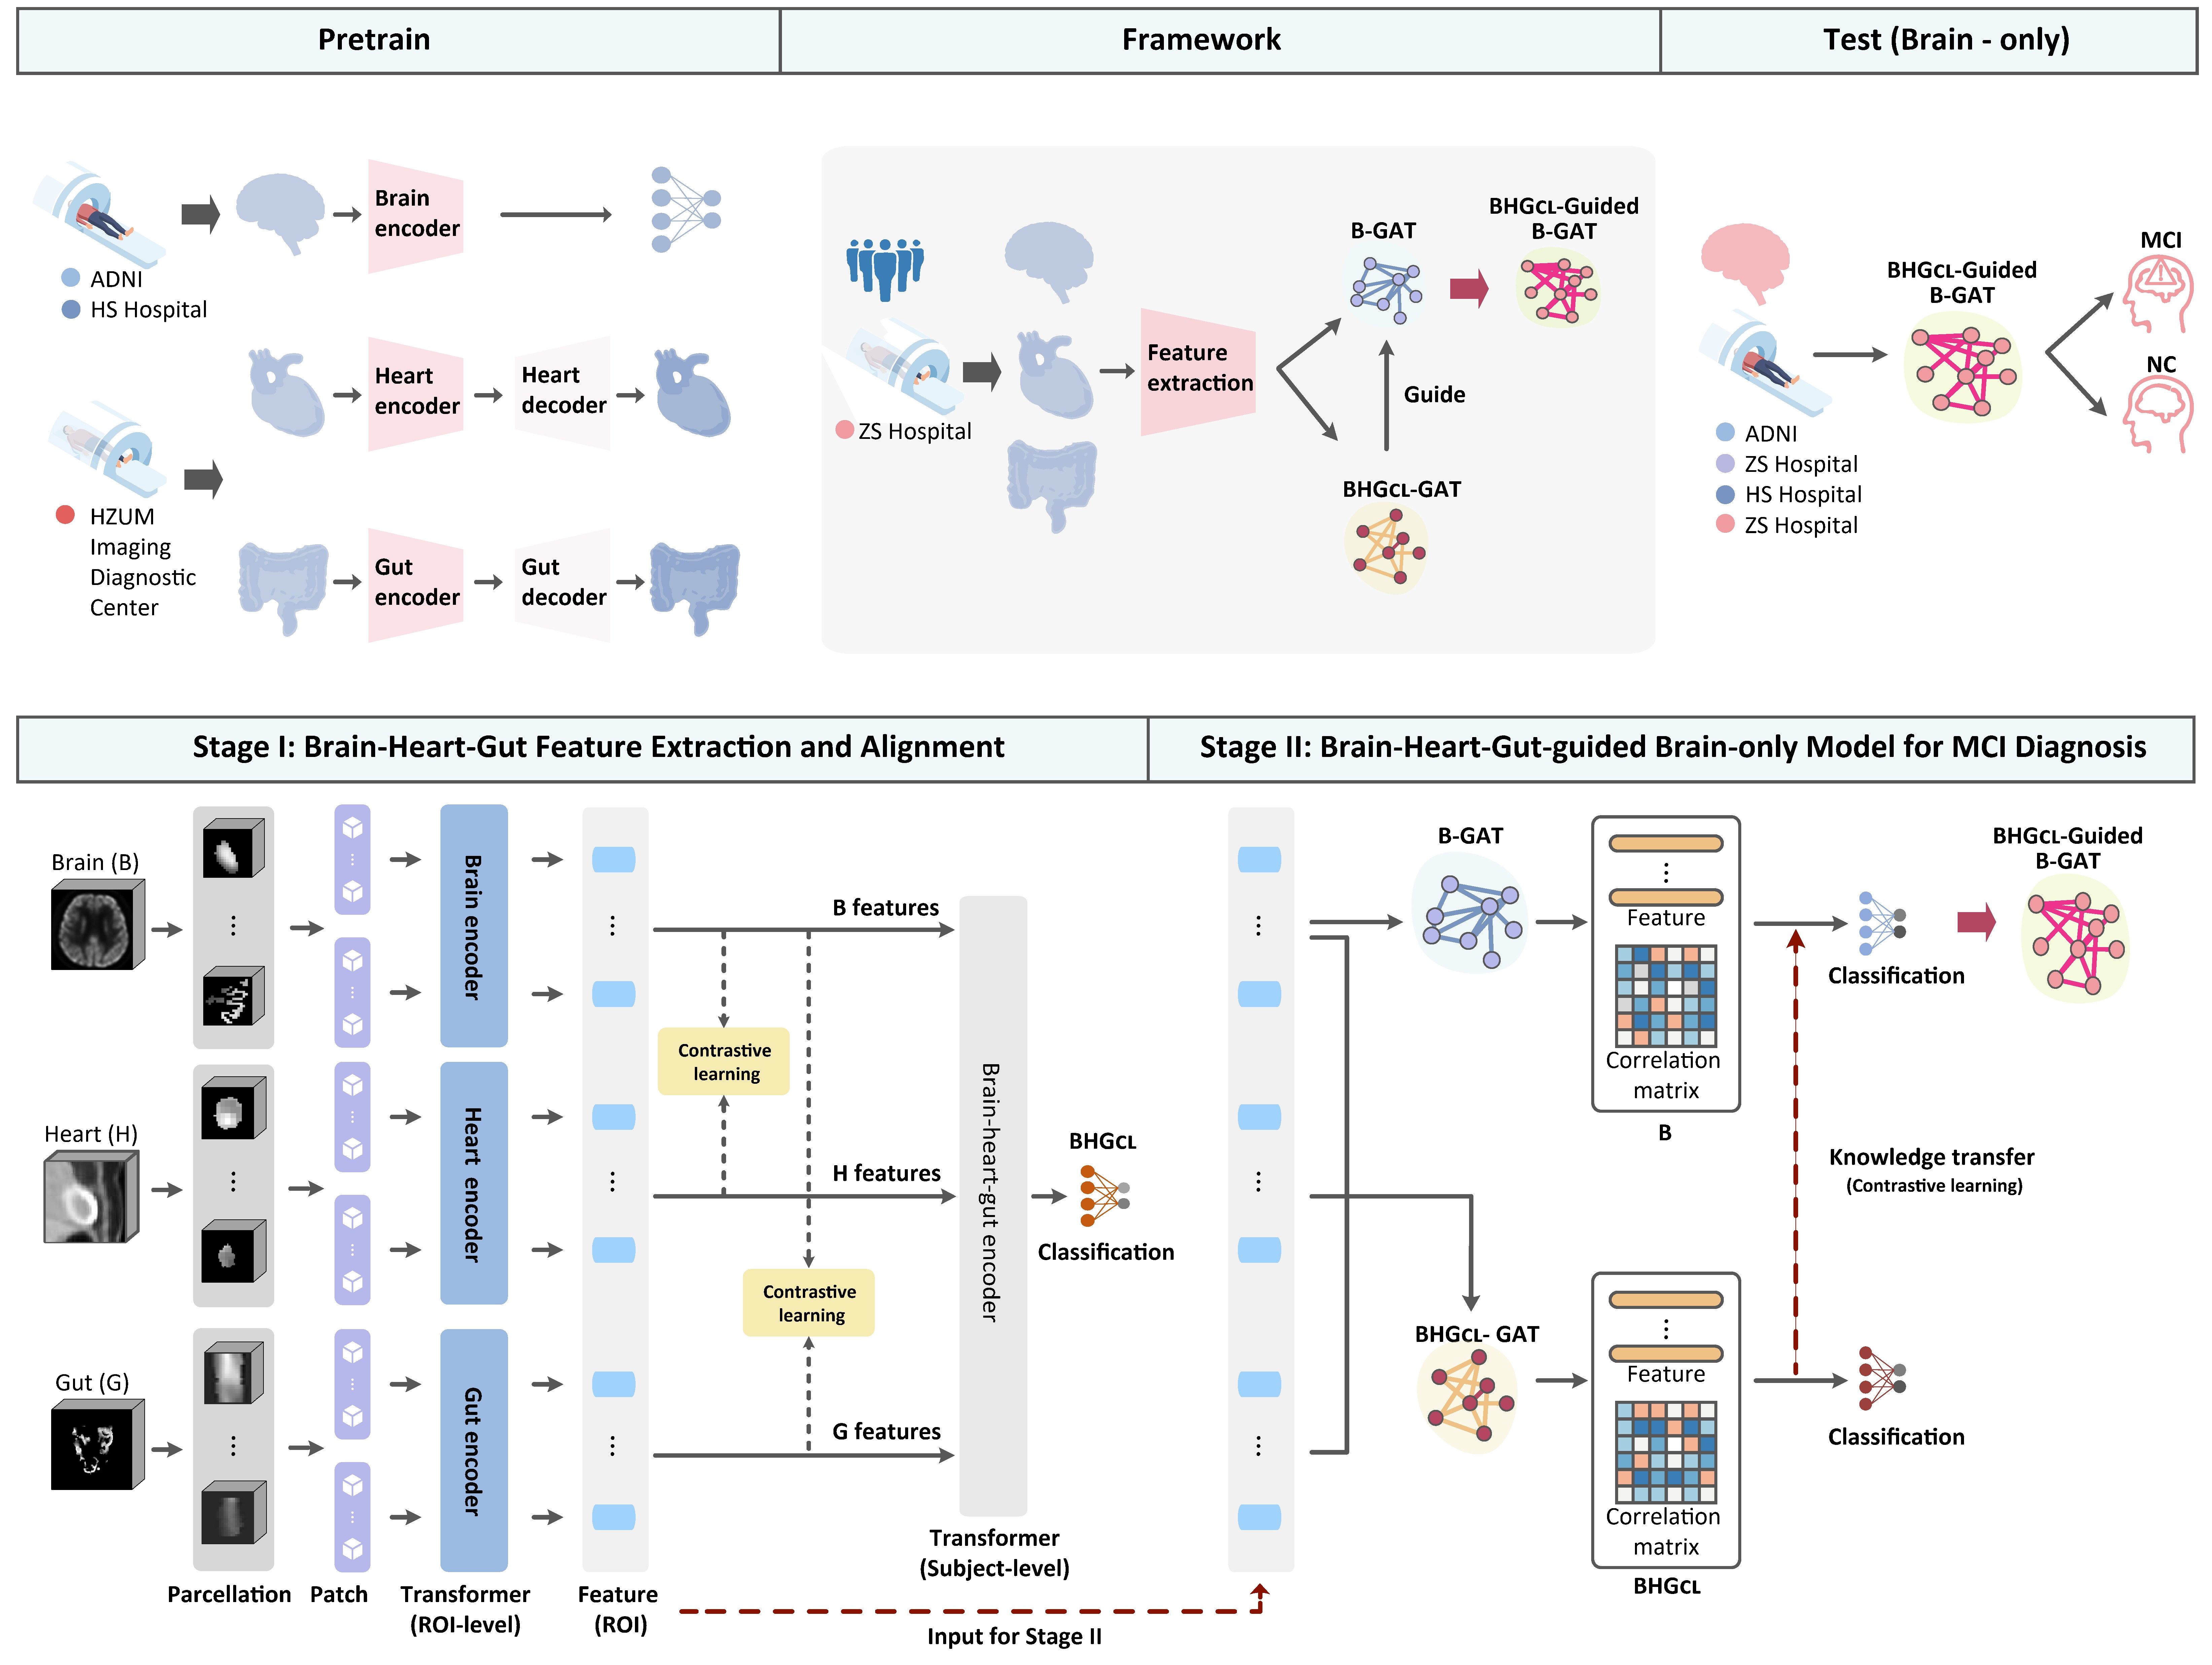
In stage I, our model is pretrained based on self-supervised learning and fine-tuned on high-quality whole-body PET to extract and align disease-related brain, heart, and gut features. In stage II, these brain, heart, and gut features are used to build a BHG graph attention network (GAT), which is then transferred to a brain-only model B-GAT for easing clinical translation. Specifically, in stage I, multi-level (ROI and subject levels) transformers and contrastive learning (CL) are employed to extract features of each ROI of the organs and align the heart and gut features toward brain features. In stage II, a dedicated GAT is proposed to fuse the aligned features from stage I and represent interactions among brain (B), heart (H), and gut (G). Besides, we employ this brain-heart-gut-based model BHGCL -GAT to guide the brain-only model B-GAT, such that in the testing phase, our BHGCL -guided B-GAT model can be easily applied to the clinical scenario where only brain PET images are acquired for MCI diagnosis.
Results
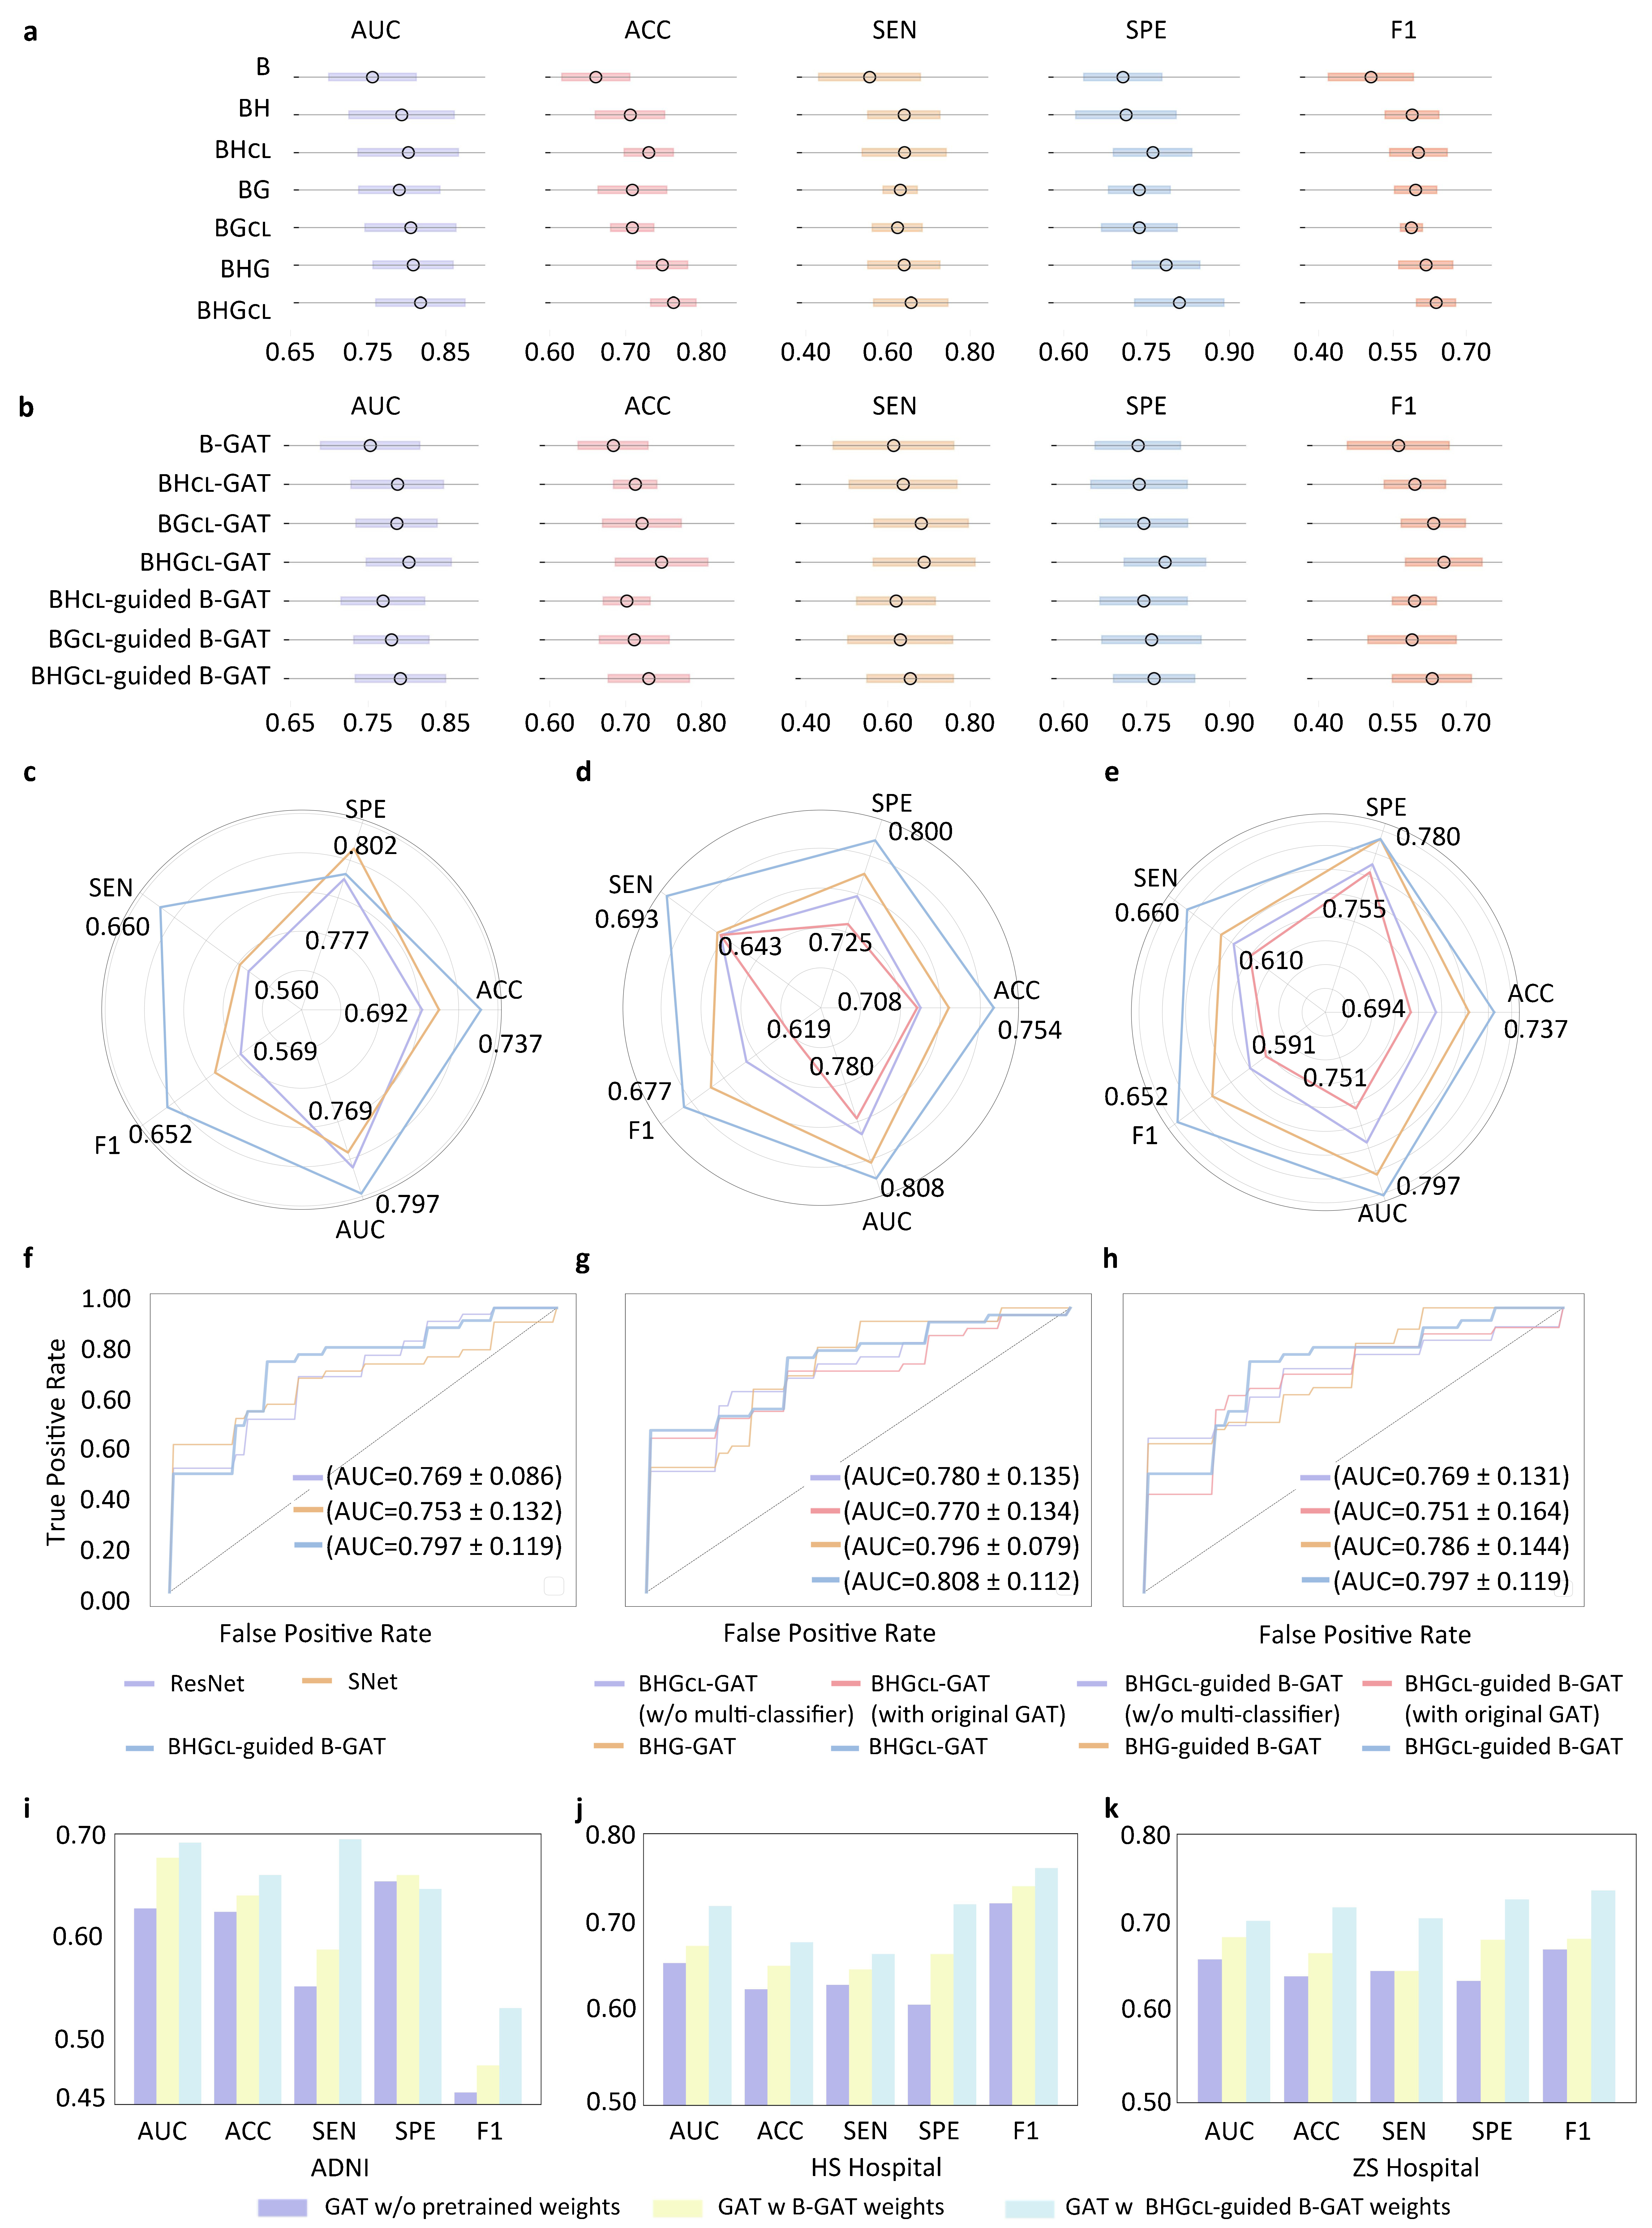
Evaluation of the proposed framework. (A) Classification performance in feature extraction stage (stage I). The circle represents the mean value, and horizontal line indicates the standard deviation across 5-fold cross-validation. (B) Classification performance in the (BHGCL)-guided B-GAT classification stage (stage II). (C) Comparison with the representative methods via radar chart. (D) Ablation study for BHGCL -GAT model via radar chart. (E) Ablation study for BHGCL-GAT-guided B-GAT model via radar chart. (F) Comparison with the representative methods via the ROC curves. (G) ROC curves for ablation study of BHGCL-GAT model. (H) ROC curves for ablation study of BHGCL-GAT-guided B-GAT model. (I) Generalizability study on ADNI. (J) Generalizability study on HS Hospital data. (K) Generalizability study on ZS Hospital data.

Top connectivity analysis across brain, heart, and gut (A) Schematic illustration of top 15 connectivities between brain and heart. (B) UpSet plot of top 15 connectivities between brain and heart. Vertical axis shows brain ROIs, and horizontal axis displays heart ROIs followed by gut ROIs. Highlighted dots represent existing connectivities among these ROIs, with the corresponding lines showing the relative connectivity strength. The percentages indicate the ratio of current connectivity strength to the maximum connectivity. (C) Schematic illustration of top 15 connectivities between the brain and gut. (D) UpSet plot of top 15 connectivities between the brain and gut. (E) Schematic illustration of top 15 connectivities across the brain, heart, and gut. (F) UpSet plot of top 15 connectivities across the brain, heart, and gut.
Citation
@ARTICLE{li2026enhancing,
  title={Enhancing diagnosis of mild cognitive impairment through brain-heart-gut metabolic networks in whole-body PET imaging},
  author={Li, Fan and Bai, Shuwei and Liu, Yuxiao and Chen, Ziyi and Zhao, Shilun and Ding, Zhongxiang and Xie, Fang and Xu, Yin and Yue, Ling and Zhang, Han and Zhang, Ya and Sun, Kaicong and Shen, Dinggang},
  journal={Cell Reports Medicine},
  volume={7},
  number={2},
  year={2026},
  publisher={Elsevier}
 }